MiniDOTs Weather Superstorm Sandy Flooding
July 6, 2017
miniDOT Used to Understand Metabolism of Steppe Rivers
July 12, 2018Calibrating miniDOT with the Ice-Bucket Test
Project Details
- PRODUCT(S): miniDOT® Logger
- APPLICATION: Laboratory
- PARAMETER: Dissolved Oxygen, Temperature
- LOCATION: Berkeley, California, USA
- ORGANIZATION: UC Berkeley Biometeorology Lab
- RECOGNITION: Joseph Verfaillie, Development Technician

Case Study Description
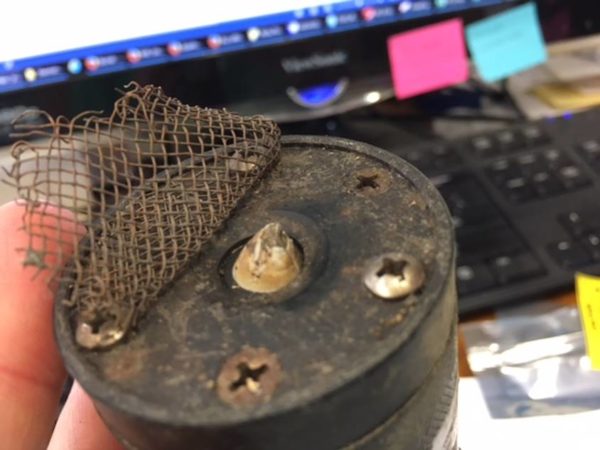
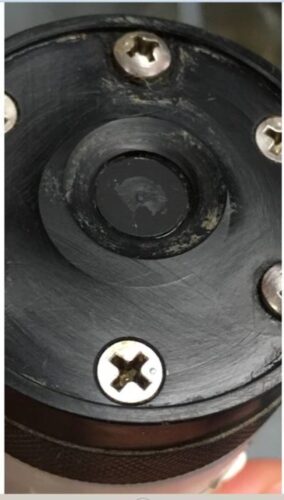
A PME customer, Joseph Verfaillie, reported that a conical barnacle had grown onto the sensor of his miniDOT logger. His miniDOT, calibrated in August 2014, had been in near-continuous use in the field for the last three years. He inquired with PME to gain insight into the best way to remove the barnacle.Per PME’s suggestion, Joe soaked the miniDOT in vinegar for 12 days, changing the vinegar a couple of times throughout. After soaking, the barnacle did come off, but some of the silicone cover of the sensor went with it. To ensure that the sensor was still working properly, PME suggested that Joe do an ice-bucket test.
The Ice-Bucket Test Vs. Normal Calibration

An ice-bucket test is the most comprehensive way to verify the calibration of a miniDOT logger. It verifies that the miniDOT reads 100% saturation of oxygen in water over a temperature span. This is a simple way to see if a sensor has been damaged or not.
Normal calibration verification requires a miniDOT to be placed in 4 gallons of freshwater, with an aquarium pump and air stone to create a bubble stream. The black end cap of the miniDOT must be facing upwards, or bubbles will accumulate in the end cap area, causing the miniDOT to incorrectly sense the DO in the water. Measurements can be recorded for several hours or up to a day to allow for the miniDOT’s temperature to come to equilibrium with the water.
An ice-bucket test differs from a normal calibration verification test because ice is mixed into the water until it is close to zero degrees, and then removed. Measurements are then recorded for the next 24 hours as the water returns to room temperature.

Data from the miniDOT Ice-bucket Test
In this case, Joe had two miniDOTs with the same manufacture date and working history, making it possible to compare the calibration of the cleaned miniDOT to an identical miniDOT with no previous damage from barnacles. His findings are depicted in the following graph, which displays three sets of measurements from each miniDOT.
The orange line, which under close inspection is actually covering the blue line, shows the temperature within the test. Around 9:45am, the two miniDOTs are placed into the bucket of freshwater. Just after noon, ice is added to the bucket and the water drops to 5 degrees Celsius. The water begins to warm up to room temperature of 23 degrees Celsius at midnight before dropping a degree or two near morning the following day.
During this cool-off period, the green line, which under close inspection is over the blue line, represents the oxygen concentration (mg/l) observed in the ice-bucket test. Cold water holds more oxygen than warm water, therefore, the bubbles flowing during the experiment move oxygen from the air into the cold water and then later back out of the warm water.
The yellow and slightly visible grey lines show the computed ratio of measured oxygen to the oxygen that is expected in water of the temperature shown under ideal circumstances. In an ideal situation, the bubbles will keep the oxygen saturation in the water at 100%.
Explaining the discrepancies in oxygen saturation 95% Saturation Observed
There are a few scenarios that could explain the 5% error reading between the expected oxygen concentration of 100% and the observed saturation of 95%. The observed ratio could be a result of the customer not entering the actual atmospheric pressure present during the test. Less actual atmospheric pressure results in less expected oxygen in the water. If Joe used an atmospheric pressure that was greater than true atmospheric pressure, the observation errors on the figure above are explained.
Here’s what Joe had to say about the methods used in the experiment:
“I was interested in comparing the two sensors and not absolute values, so I just used the default pressure in the PME software to calculate the saturation values. Also, it’s possible that my bubbling system was not optimal: I didn’t have a stone, just a 1/8″ ID tube.”
In addition, a 5% error could be the result of an initial calibration mistake. PME specifies 5% accuracy for miniDOT; this mistake would be at the edge of good performance. PME specifies performance at the time of sale, but we do not specify how stable this performance is as years go on. Therefore, the initial calibration could have been perfect and the sensors could have changed their calibrations during the three years of use.
Initial Dip in Saturation
The initial large error in oxygen saturation (the sharp downward spike in the yellow/grey lines) can be attributed to two different scenarios.
Because it takes time for bubbles to exchange oxygen into the water, the return to saturation the miniDOTs measured could simply be the bubbles gradually dissolving oxygen into the now cold water. Thus, the miniDOTs could have simply and accurately observed the process of bubbling.
The other possibility is that the temperature is changing too swiftly to make an accurate measurement. The miniDOT makes a slow measurement of temperature, therefore if the conditions are changing too rapidly, it could be making a measurement error.
Comparing Cleaned and Non-Cleaned miniDOTs
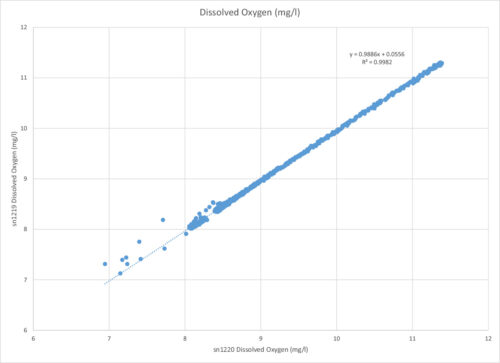
In the data table below, you’ll note that the two sensors had very similar measurements. This “REG” graph shows the oxygen measurement from the non-cleaned sensor plotted to that of the cleaned sensor.

As discussed earlier, there are few factors that could have led to the discrepancies in the data, but the different readings between the two sensors was only a small 1.7%. In an ideal situation, the sensors would have read the same oxygen, meaning this plot would be a line through zero with a slope of 1. Given the circumstances, this was a minor discrepancy.
In conclusion, the results found during the ice-bucket test were extremely satisfactory. After three years of significant use, the absolute measurement error of the miniDOT was within initial spec. In addition, compared with an identical sensor with similar usage, their calibrations were found to be highly agreeable.

