


Understanding Wildlife Inputs in the Mara River
June 6, 2017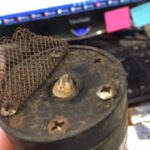
Calibrating miniDOT with the Ice-bucket Test
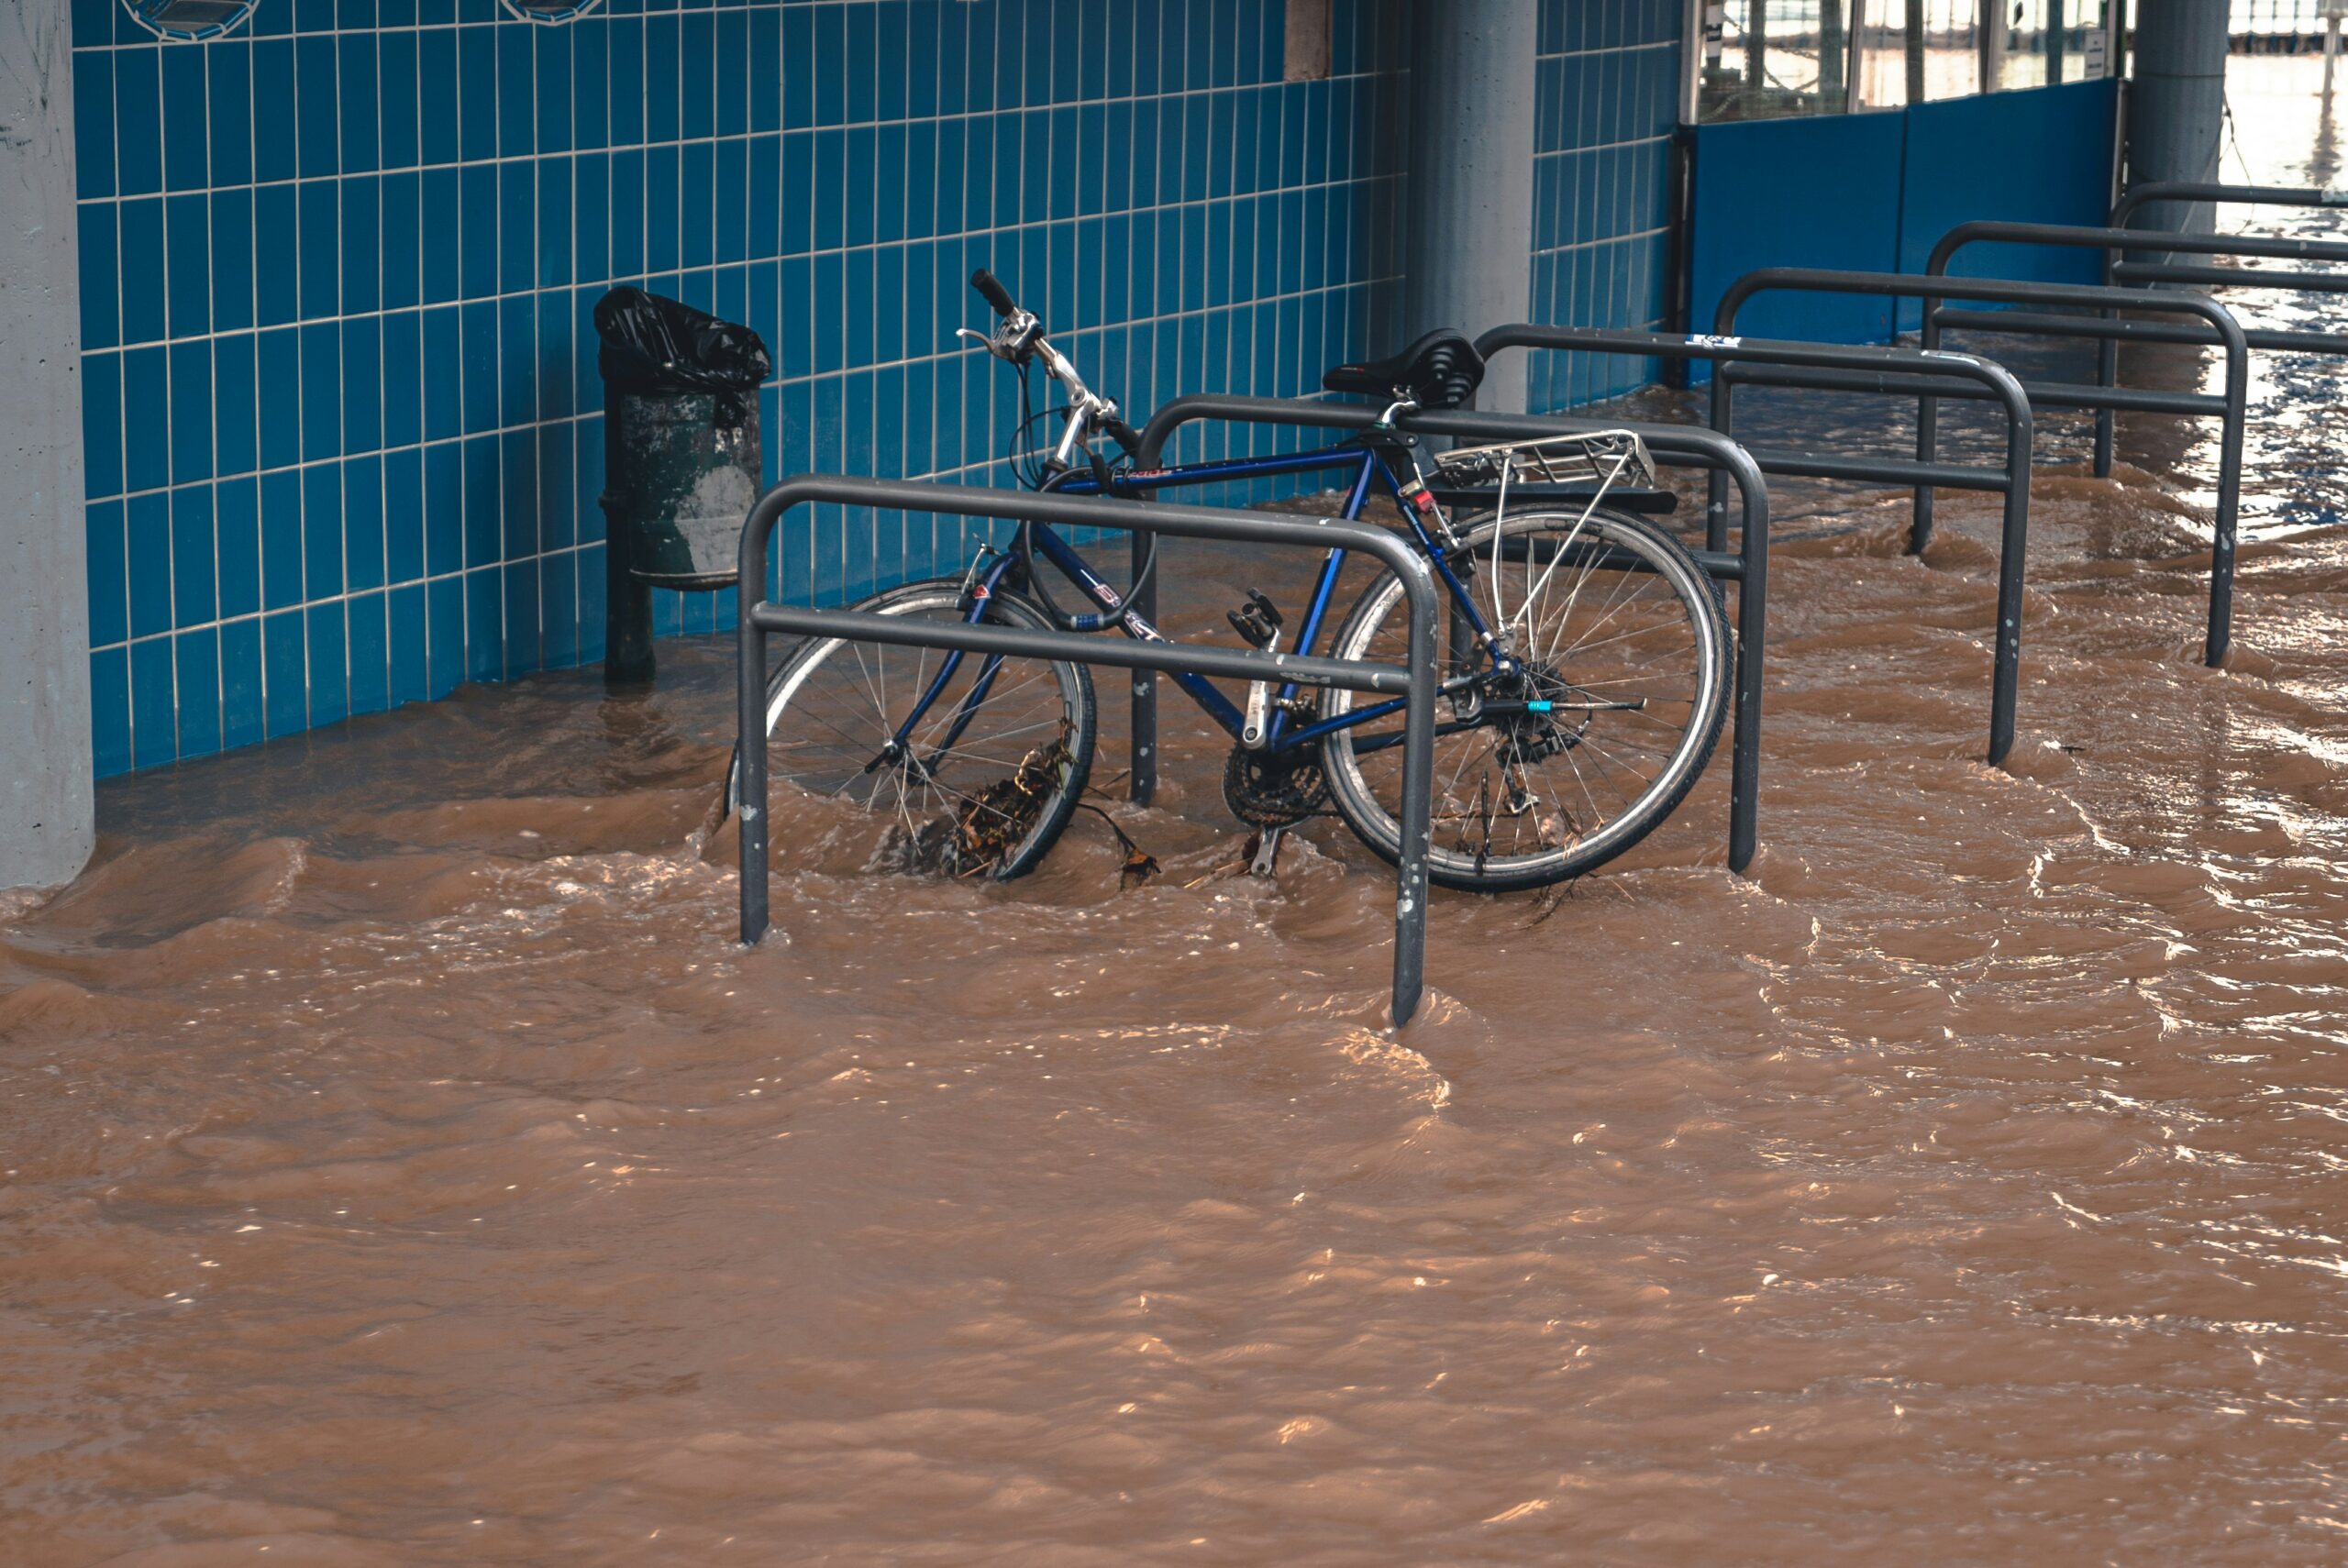
January 22, 2018miniDOTs Weather Superstorm Sandy Flooding
Project Details
- PRODUCT(S): miniDOT® Logger
- APPLICATION: Surface Water
- PARAMETER: Dissolved Oxygen, Temperature
- LOCATION: Baltimore, Maryland, U.S.
- ORGANIZATION: Cary Institute of Ecosystem Studies
- RECOGNITION: Dr. Alexander J. "AJ" Reisinger
Case Study Description
Researchers used miniDOT loggers to study stream metabolism in response to flood events around the city of Baltimore. One array of miniDOTs was active during the intense flooding from Superstorm Sandy, but remained anchored and logging data for the entirety of the flooding event.
Oxygen data used to determine stream metabolism
Flooding events influence urban streams such as those found in Baltimore, Maryland. When these flooding events occur, these streams’ ability to produce energy (Gross Primary Production, GPP) and their demand for energy (Ecosystem Respiration, ER) change. These two ecosystem functions ultimately represent a stream’s metabolism, or its Net Ecosystem Productivity (NEP).
If a stream’s NEP is measured as greater than one, then more energy is produced in the stream than is consumed. If NEP is less than one, the stream is a net consumer of energy, and may be relying on external energy inputs, such as leaves falling into the water. Understanding GPP and ER is critical in knowing how overall stream characteristics such as NEP might react to flooding and how this reaction may affect other ecosystem functions such as food web dynamics.
Dr. Alexander J. “AJ” Reisinger, of the Cary Institute of Ecosystem Studies, and his team were interested in finding out if the size of the flooding event would determine
 the amount of time needed for the streams’ metabolisms to recover. Because the level of dissolved oxygen (DO) over time is used to measure GPP and ER, the PME miniDOT was a perfect tool to use to determine NEP.
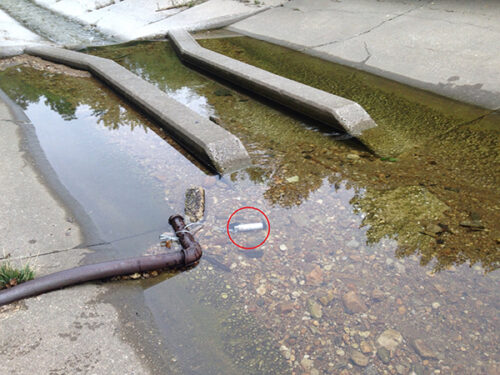
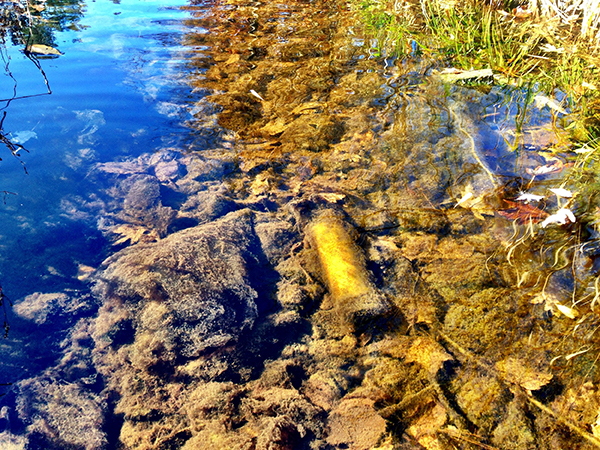
Sixteen miniDOTs were deployed in 10 streams in and around Baltimore and left to measure DO and temperature for
a period of two years starting in 2015.
Superstorm Sandy data provided useful comparison
These miniDOTs recorded the DO of many minor flooding events, but lacked a significant flooding event for comparison. A co-advisor of Dr. Reisinger, Dr. Emma Rosi, had used an array of five miniDOTs 3 years prior in Baltimore, during which their deployment suffered through Superstorm Sandy, an uncommonly large storm and flooding event. All the miniDOTs survived the storm and even remained anchored and logging for the entirety of the event.
“A few weeks after Sandy, Dr. Rosi returned to Baltimore, assuming that the miniDOTs had washed away or the sensors wouldn’t work,” Dr. Reisinger said. “Luckily, all of the sensors were still working and logging data.”
Stream NEP recovered from flooding in 4-18 days
The combination of data between these two researchers and their teams created a more whole picture of the NEP recovery time for these waterways.
Although subject to other stressors, such as nutrient loading, the NEP of the streams in Baltimore was mostly affected by flooding. The size of the flooding event itself did not affect the streams’ metabolic recovery time of 4-18 days. However, GPP and ER were affected differently. On average, GPP and ER were reduced by 80% and 66%, respectively, post-flood, but both recovered within the average recovery time.
Read the full research paper, published in Ecosphere, here.
Researcher plans to continue using PME instruments
Dr. Reisinger said, “The miniDOTs are incredibly easy to use, reliable, and low-cost compared to some of the other options for DO loggers. We’re continuing to monitor DO using miniDOTs in Baltimore, and I plan to continue using PME sensors when I start my own lab in the fall of 2017.”