


Getting a Sense for Hurricanes
March 22, 2018
miniWIPER Keeps Researchers Out of the Muck
May 17, 2018
Over the course of the 2017/18 southern hemisphere summer, 20 miniDOT® Loggers were deployed by researchers from the National Institute of Water and Atmospheric Research (NIWA) in Hamilton, New Zealand. The loggers, are part of a larger research initiative to observe the eutrophication effects on a catchment scale.
The loggers were deployed to record dissolved oxygen (DO) and temperature. The loggers were placed in streams within a catchment primarily subject to agriculture, and dairy farming, with hopes of learning more about the characteristics of the dissolved oxygen.
Streams in these areas are low gradient with soft-bottom substrate that supports large amounts of aquatic plant life. They generally have depressed DO concentrations, particularly overnight, as a result of the high plant biomass combined with low flows and high temperatures.
In NZ, proposed national thresholds for DO are based on oxygen minima (either 1- or 7-day minima values) and therefore require continuous monitoring to assess the DO state.
Next summer, the researchers at NIWA are planning to double the number of miniDOT® Loggers deployed to continue their efforts. In addition, they also plan to trial the miniWIPER automatic wiper system, at some of their key locations.
The miniDOT® Loggers were chosen for this research as they provided an economic means of monitoring DO continuously across multiple sites within a catchment. Contact us to see what a miniDOT® Logger could do for your research.
A big thank you to Dr. Craig Depree, Environmental Chemist at NIWA for providing this information and images.
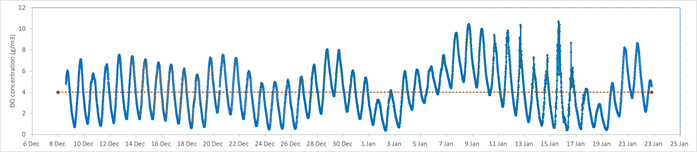
Figure shows 6-week DO concentration time-series on a 4th order stream in the Piako catchment (Waikato, New Zealand – see picture below showing high macrophyte biomass). The red dashed line represents the recommended ‘bottom-line’ threshold value of 4 g/m3. Diel minima at this site were continuously below this value (often <1 g/m3) for most of the monitoring period. The period in early January where the minima was >4 g/m3 corresponded to a storm event that increased stream the flow rate.


