

Monitoring Shallow Water Habitat in the SW Baltic Sea
July 16, 2019
Short-Term Variability in Water Quality in Indian Bayou
August 27, 2019The Tale of Two Wipers
Project Details
- PRODUCT(S): miniWIPER for miniDOT
- APPLICATION: Coastal / Ocean
- PARAMETER: Dissolved Oxygen, Temperature
- LOCATION: Mid-Latitude Pacific Ocean
- RECOGNITION: Ryan Walter, Assistant Professor California Polytechnic State University, College of Science & Mathematics and David Dann, Marine Operations Manager & Coastal Oceanography Technician, UC Davis, Bodega Marine Laboratory.

Case Study Description
This case study presents the experience of two customers. Both used miniWIPER with miniDOT. Both sensors & wipers were exposed to similar fouling experiences as they were placed in similar locations in coastal waters of California over concurrent times. Despite the similar uses these customers experienced different fouling effects which could be a result of key differences including cleaning routines, the use of the copper plate, and wiping intervals. The following case study evaluates both uses of the sensors.
The Tale of Two Wipers
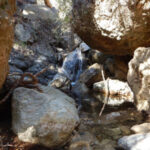
The table below shows that there were many similarities between the two wiper experiences. In particular the recovery pictures show both sensors were heavily fouled when recovered. However, and with regard to sensing [Dissolved Oxygen (DO)], the miniDOT sensing foil appears free of fouling organisms for Wiper A whereas the sensing foil of Wiper B is nearly covered by a large shell.
The implication here is that the miniDOT with Wiper A had a much better opportunity for accurate sensing than the miniDOT with Wiper B. The presence of fouling organisms is irrelevant at all locations on miniDOT except on the sensing foil. Organisms on the foil are alive and use or produce oxygen. This activity disconnects the measured oxygen (which is done within the foil under the organism) from the oxygen in the surrounding water, which is the desired measurement.
The miniWIPER is unique among stand-alone wipers since it records various parameters at each wipe. After recovery these recordings can be downloaded and reviewed. They tell a story of the performance of the wiper during oxygen sensing.
Research Contact
Wiper A: Ryan Walter, Assistant Professor California Polytechnic State University, College of Science & Mathematics
Wiper B: David Dann, Marine Operations Manager & Coastal Oceanography Technician, UC Davis, Bodega Marine Laboratory
Development Location:
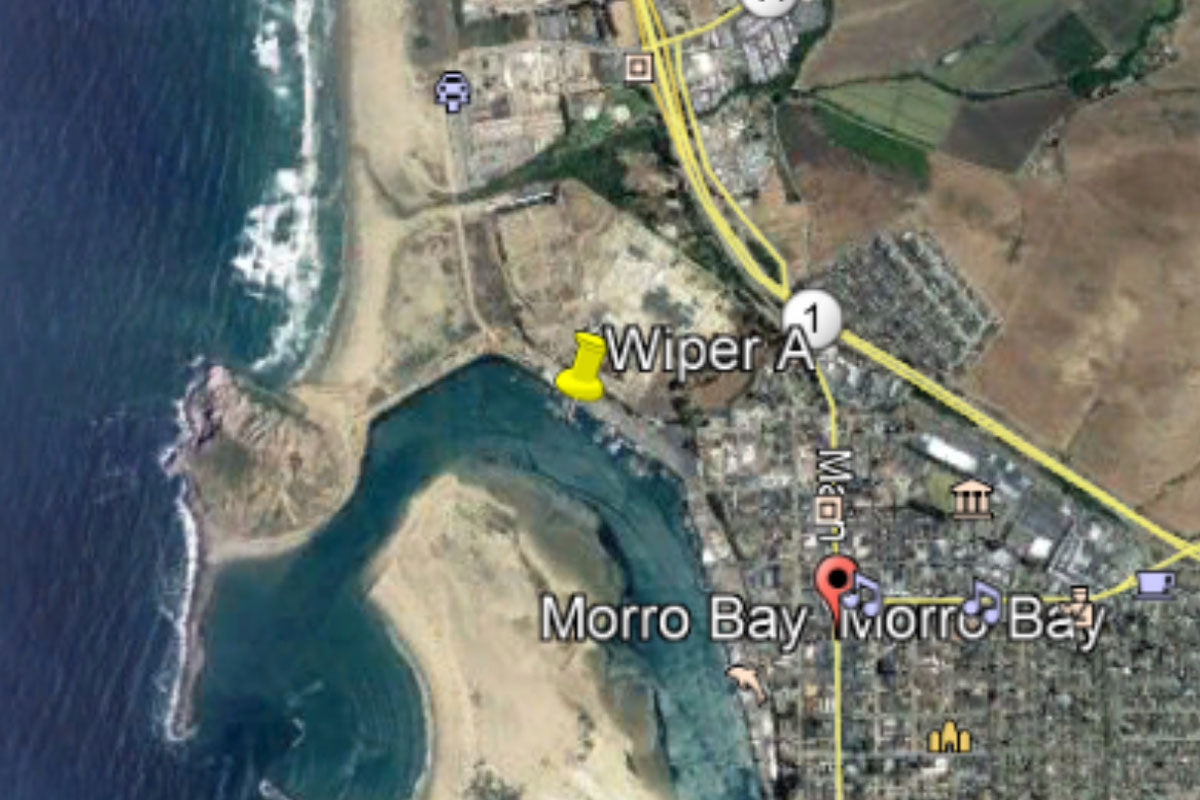
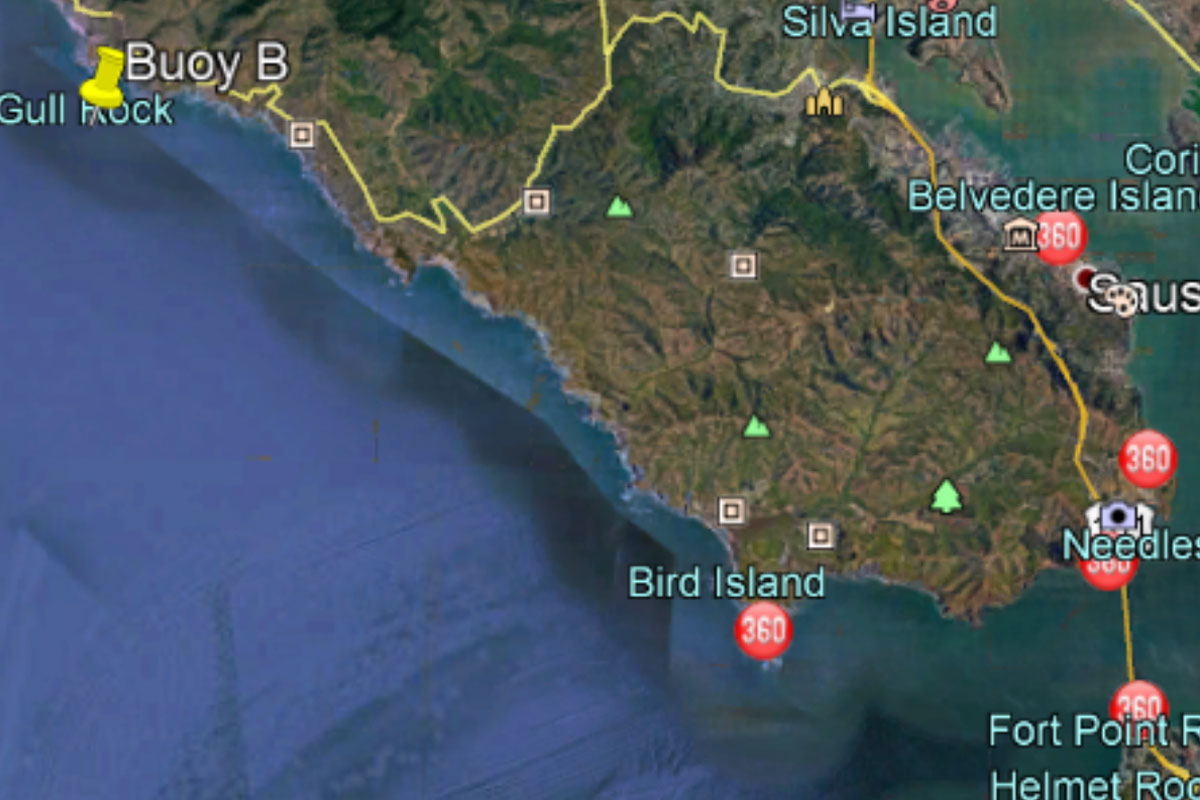
Wiper A: Coastal California 35 deg N. Just inside Morro Bay outlet.
Wiper B: Coastal California 37 deg N. Just outside San Francisco bay outlet.
Development Depth:
Wiper A: 7 meter in 8.5 meter total depth (1.5 meter from bottom)
Wiper B: 16 Meter in 18 meter total depth (2 meter from bottom)
Deployment Period
Wiper A: 12 Months | Wiper B: 5 Months
Wiper Interval
Wiper A: 3 hours | Wiper B: 6 hours
Wipes
Wiper A: 3000 | Wiper B: 700
Battery Replacement
Wiper A: No | Wiper B: No
Service Interval
Wiper A: 3 times (Jun, Jul, Nov) removed but copper plate and sensing foil not cleaned.
Wiper B: Not serviced
Copper Plate
Wiper A: Yes
Wiper B: No
Development Location Picture:
Wiper A
Wiper B
General Operation
Wiper A - Wiper B
Wipe Time
Wiper A: Wipe Time
Wiper B: Wipe Time
Condition at the End of Deployment
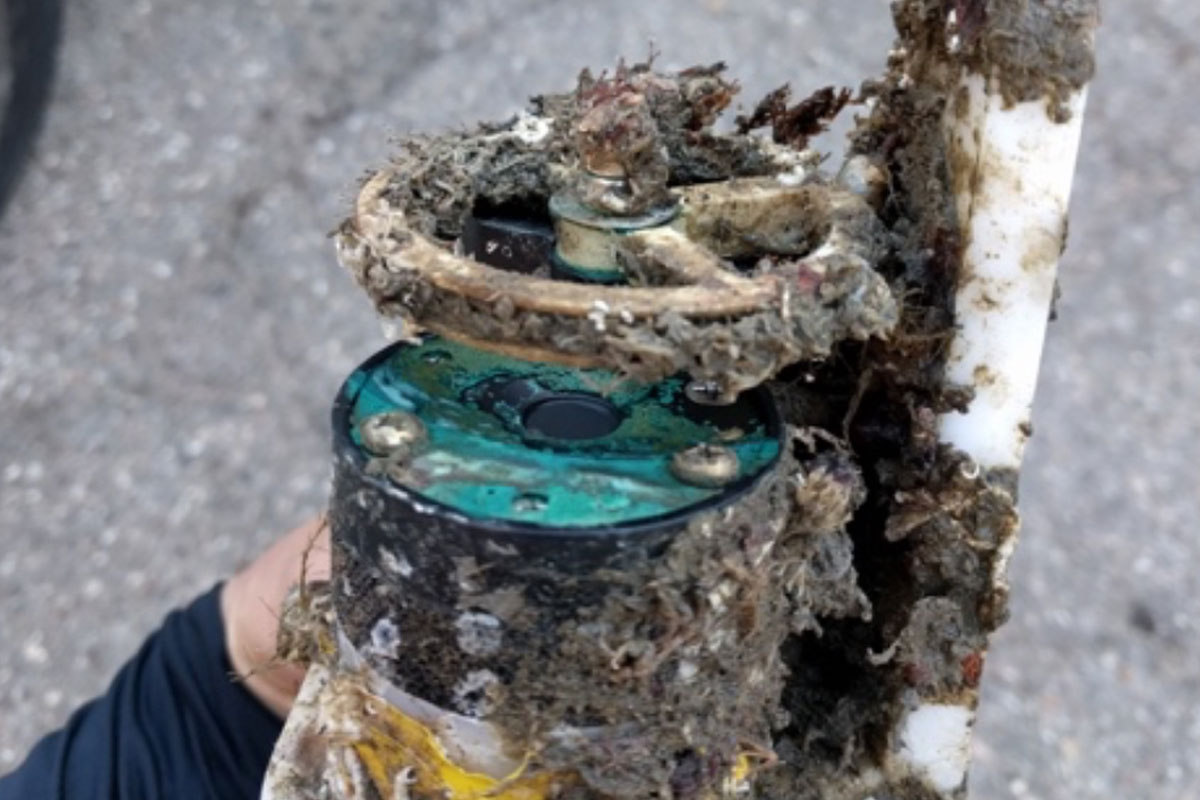
Wiper A
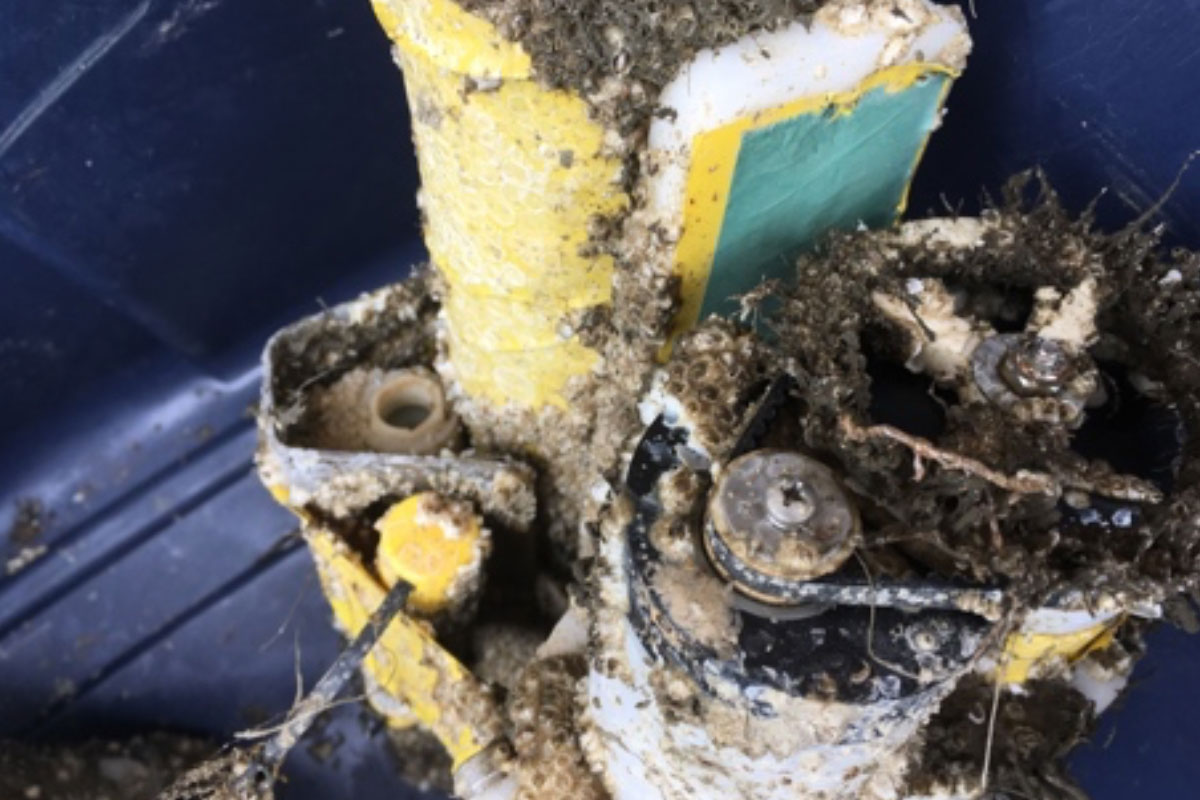
Wiper B
Condition of Sensing Foil at End of Deployment
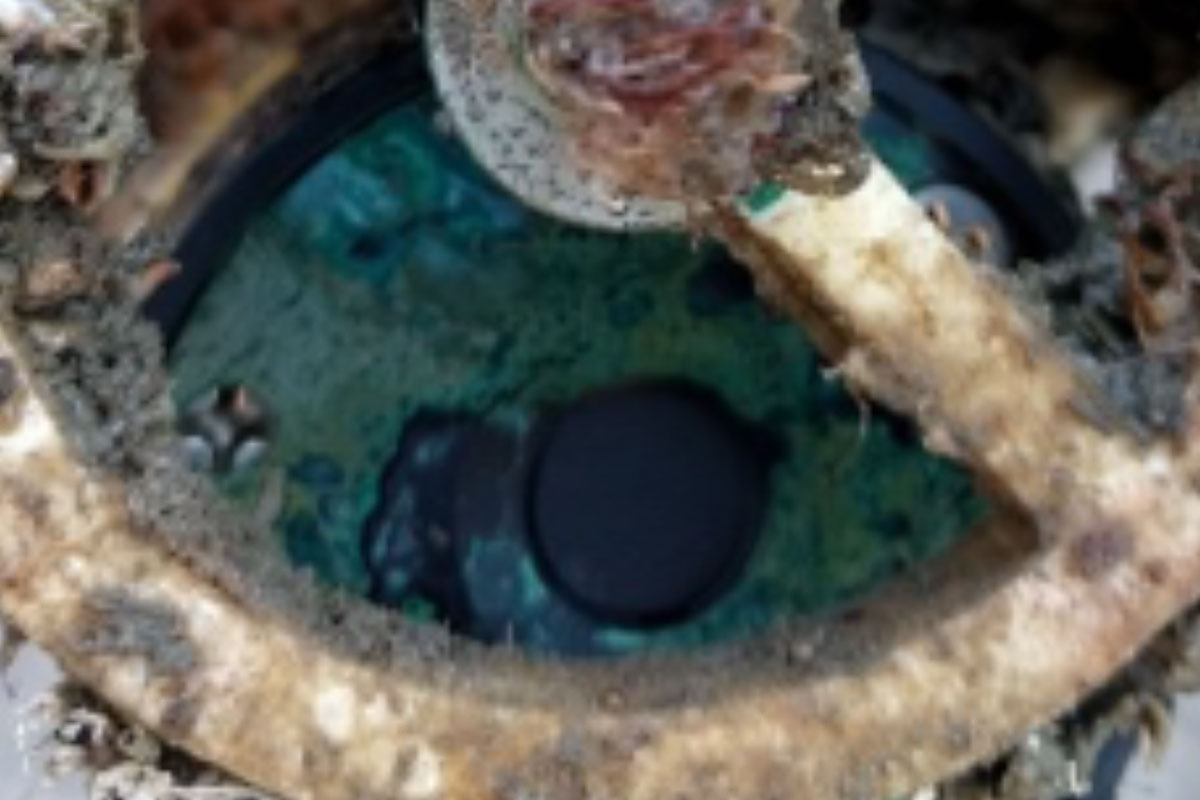
Wiper A
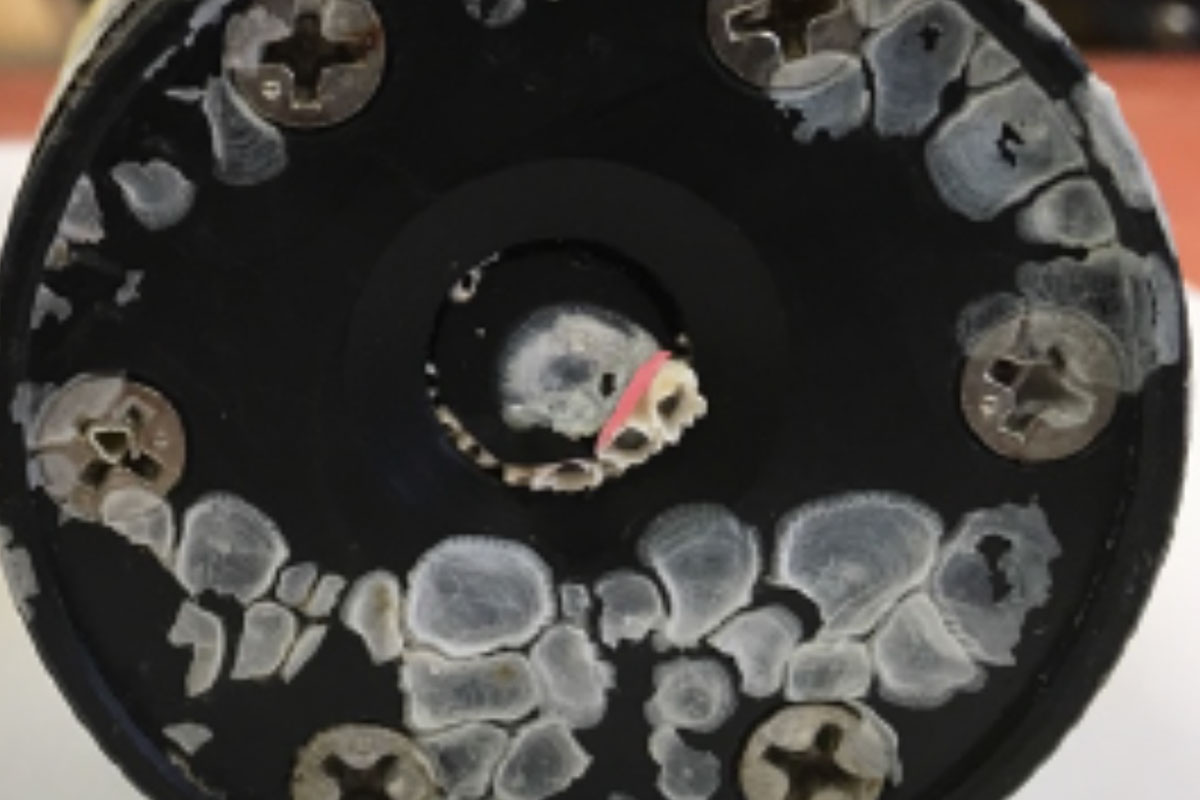
Wiper B
System Performance
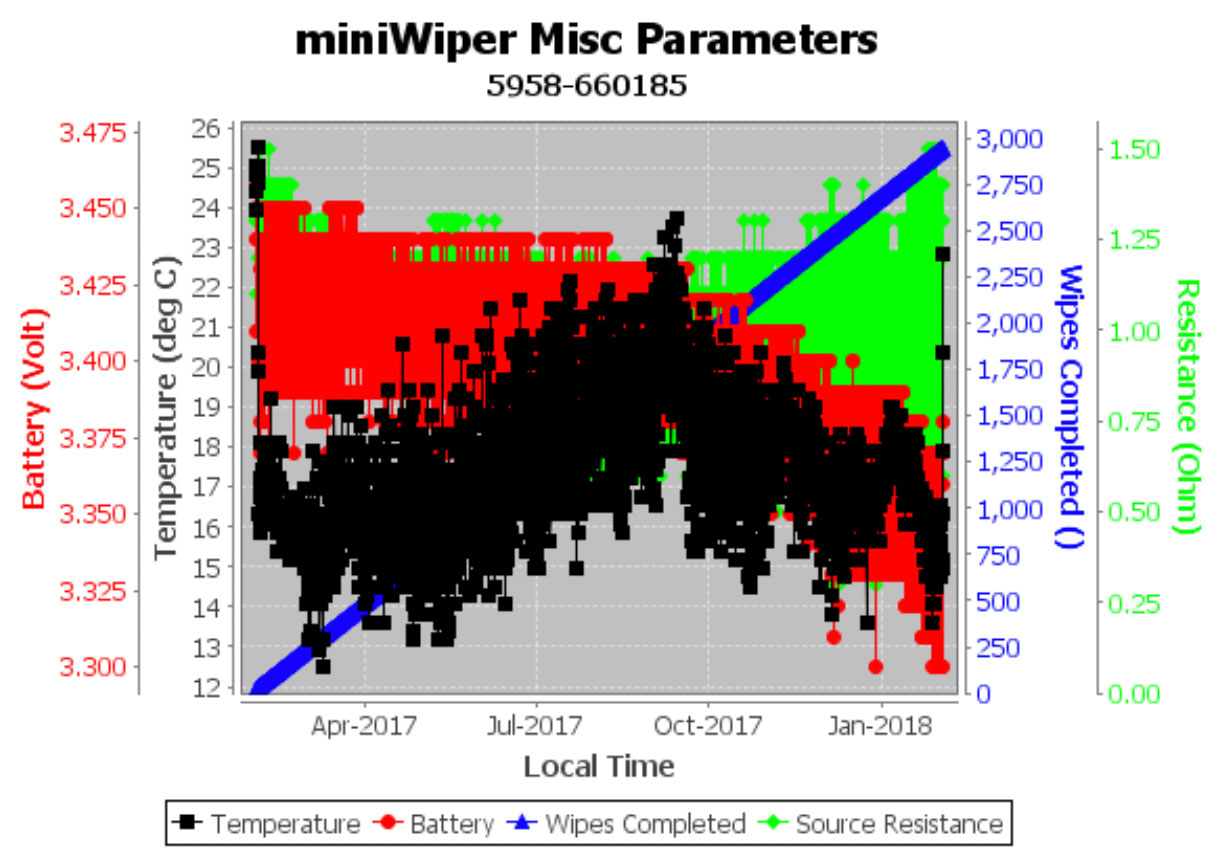
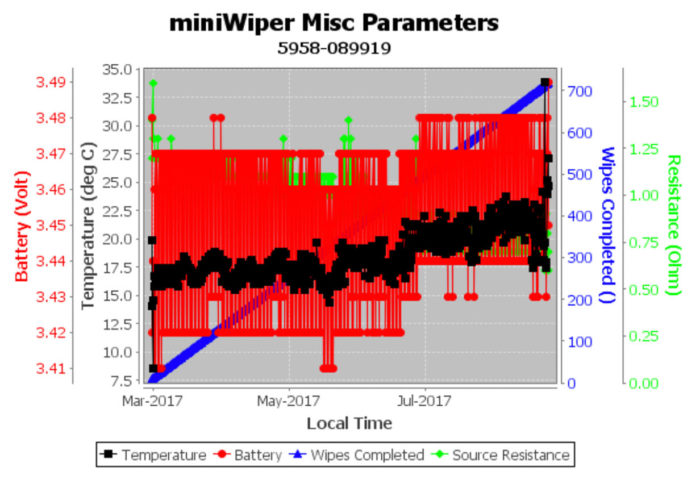
The charts below depict the overall system performance for each wiper. The blue plot represents the number of wipes completed. This gives the cumulative wipes accomplished since the wiper was manufactured. This provides a useful way to establish the total wear on wiper mechanical components. As seen below, both wipers were in new condition. Wiper A performed 3000 wipes over 12 months while Wiper B performed 700 over 5 months. A review of the individual measurements shows Wiper A wiped every 3 hours while Wiper B wiped every 6 hours.
The black plot shows that temperature for each wiper is relatively similar. The miniWIPER records temperature to provide insight into what temperature the mechanical components were exposed to as temperature has a big effect on the drive train of the wiper.
The red plot shows unloaded battery terminal voltage. Lithium batteries of this type have fairly flat discharge characteristics as the figure below shows.

Wiper A

Wiper B
Terminal voltage is also temperature dependent. For example, it takes more energy to wipe at low temperatures and more energy to wipe at deeper depths, so in general it is difficult to tell how depleted the batteries are based on voltage alone.
In Wiper B’s case it appears likely that the existing batteries could be used for another run of 700 wipes. Wiper A’s remaining battery life isn’t as clear. Some of the voltage decline could be explained by temperature but might be the precursor of the very sharp drop at battery end-of-life.
Electrical Performance
The following figures show the electrical performance of the motor, drive train, and wiper. These figures show the amount of electrical current flowing to the motor at various times during each wipe event. Starting current is monitored since the drive train can experience an initial ‘break out’ drag from various causes.
Average and peak currents give an idea of the drag of the drive train as well as the drag of the wiper as it passes over the sensor. Wipers end their wipe efforts when the brush reaches a mechanical limit (or when the wiper jams) based on the large current consumed by the stalled motor. This limit is 200 mA. The final current records the actual value that signaled the wipe end.

Wiper A

Wiper B
Wiper A appears to have little fouling throughout with some sort of growth beginning in September. This growth could correlate with the warmer conditions present at that time. On September 15th, several wipes display large peaks in current, possibly indicating points where the brush passes the growth. The wiper appears to overcome the disturbance and wiping returns to normal thereafter.
Wiper B displays a different story. There are constant disturbances that are initially overcome but finally result in a total jam of the wiper. The actual cause is unknown; however, the recordings provide information on when anomalies occur.
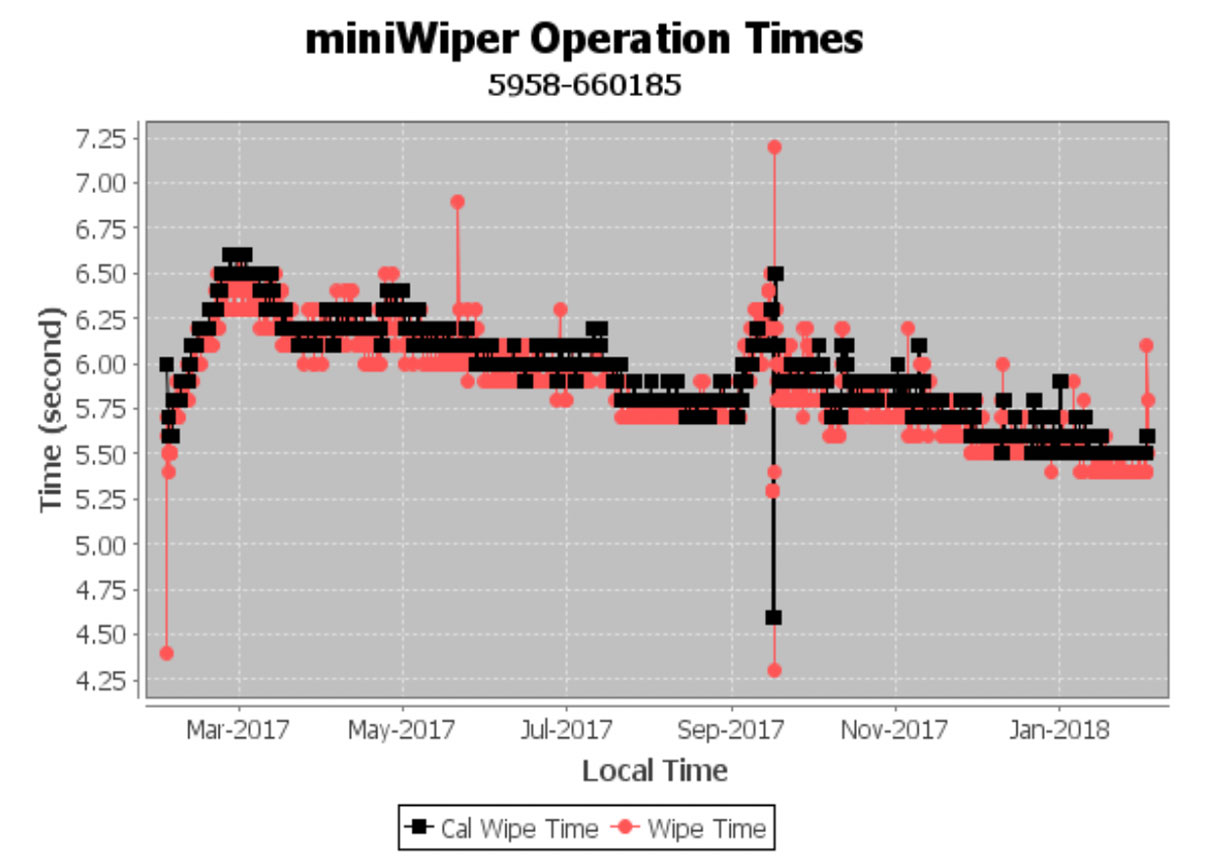
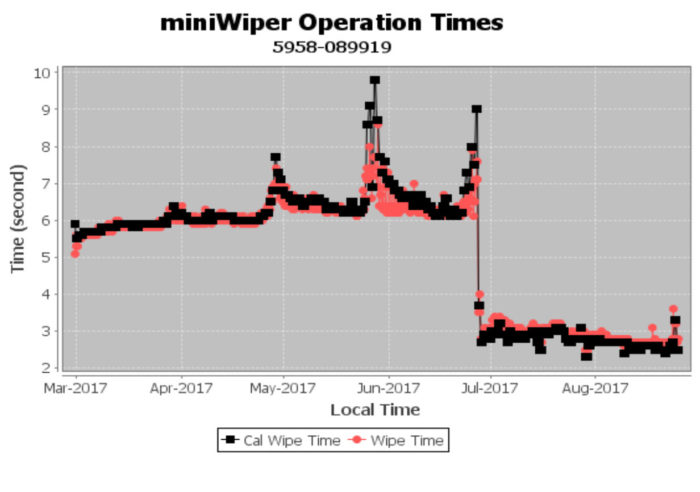
Wipe Time Performance
When wiping the miniDOT, the miniWIPER does a ‘scrub’ wipe. The scrub is accomplished by moving the wiper brush past the midpoint (the location of the miniDOT sensing foil) then backing up over the foil, and then continuing with the wipe.
The miniWIPER must know the location of the midpoint of the wipe to accomplish this scrub. miniWIPER has no circuitry or sensing to measure the actual position of the wiper brush. Instead, from time to time, it accomplishes a calibration wherein it measures how much time elapses from start to end of a simple, non-scrub, wipe. Half this time is judged to be the midpoint of the wipe. This calibration time is shown in the black line below. The red line gives the actual scrub-wipe time, with the scrubbing time subtracted. These should agree.
Wiper A exhibits fairly consistent time as is expected from the electrical currents observed. The event in September, mentioned above, is visible in the following figure as well. Wiper B shows variation and a complete stall beginning in July which appears as very short wipes.

Wiper A

Wiper B
Energy Consumption
The following figures show the energy consumption at each wipe. The wiper energy plots are useful summaries of the Electrical Currents and Operation Times since measurements from both are used to compute the energy.

Wiper A

Wiper B
Analysis of Wiper Experience
Both wipers were used relatively close to each other and over a concurrent time period which resulted in similar fouling conditions as seen in the recovery pictures.
Wiper A gave more fouling resistance than Wiper B, with recordings showing that Wiper A wiped throughout the entire duration of the deployment while Wiper B jammed due to fouling unknown interruptions.
The different outcomes for each wiper are supported by the differences shown in the table above. The miniWIPER’s unique ability to observe and record parameters for each wipe provided information consistent with the fouling observations.
Suggestions for Future Wiper Use
PME suggests that the miniWIPER not be viewed as a set-and-forget solution to environmental fouling of sensors. The miniWIPER is a tool that will help sensors resist fouling but the success will depend on fouling conditions and how this tool is used.
For the best results, we recommend the following:
- Use the copper plate with the miniWIPER
- Inspect installations as frequently as possible
- Do not leave unattended for longer than 3 months
- Set the wiper interval for approximately 3 hours
Dedicated to Delivering Precise Measurements
The miniWIPER has a relatively low initial cost and the value of the data collected makes wiping cost effective in a wide range of applications. Contact us today to learn more about the miniWIPER and how it can be applied in your research.
Submit a product quote request and we can help you achieve your goals!